Having more brand visibility grows both market share & new instructions
We’re always thinking about ways that we can offer insight that helps you most effectively target a home-moving audience, win more instructions, and build market share.
So, we’ve leveraged the scale of our data to give you a blueprint of what agents who’ve successfully built their market share and stock levels have done differently. This data relates only to Rightmove where people are most likely to be in a property mindset and looks at share of voice, a measure of your brand visibility compared to your competitors.
From the data we learnt 3 things:
- Agents with the highest market share had more brand visibility on Rightmove than their competitors.
- Agents who have more brand visibility also had more new instructions
- The optimum blend of lead generation products vs branding products to support market share
Agents with the highest market share had more brand visibility on Rightmove than their competitors.
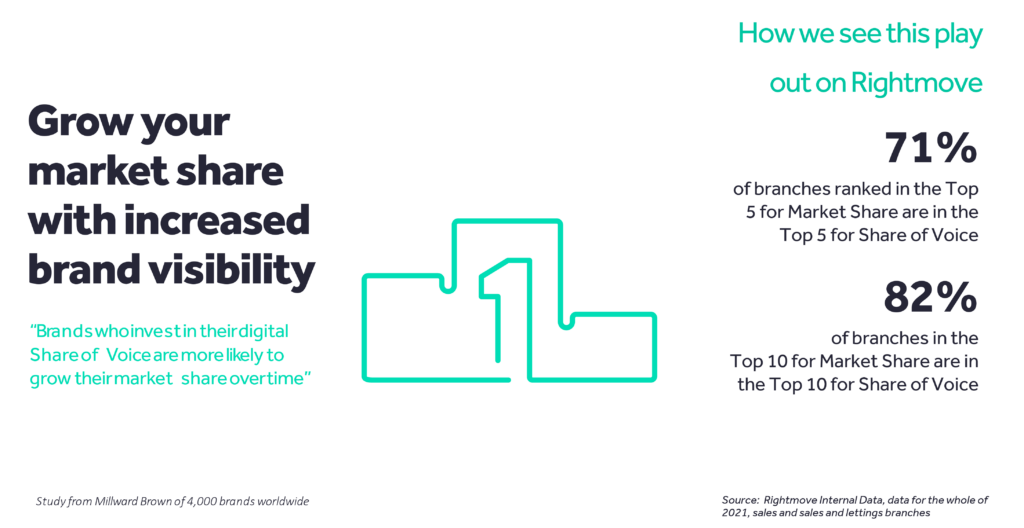
The data shows that share of voice is very closely linked to market share.
- 71% of the branches who are in the top 5 for market share are also in the top 5 for share of voice.
- A further 82% of branches who are in the top 10 for market share are in the top 10 for share of voice.
That top level data insight was so intriguing that we decided to dig a little further to see if we could find more insight to help agents understand exactly how share of voice on Rightmove could impact their results.
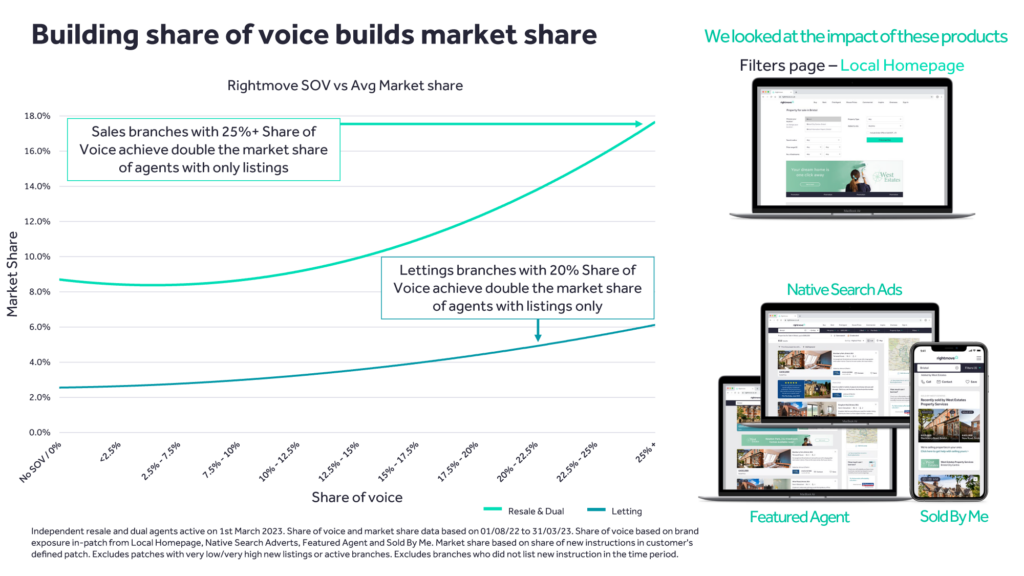
We specifically looked at Rightmove branding products:
- Local Homepage
- Native Search Ads
- Featured Agent
- Sold By Me
When we look at agent’s Share of Voice on Rightmove, which you can see on the bottom axis of this graph, with Average market share on the vertical axis, you can clearly see that agents who invest in their Share of Voice and have a stronger branded presence also have larger market share.
Agents with the highest market share had more brand visibility on Rightmove than their competitors.
The data shows that share of voice is very closely linked to market share.
- 71% of the branches who are in the top 5 for market share are also in the top 5 for share of voice.
- A further 82% of branches who are in the top 10 for market share are in the top 10 for share of voice.
That top level data insight was so intriguing that we decided to dig a little further to see if we could find more insight to help agents understand exactly how share of voice on Rightmove could impact their results.
We specifically looked at Rightmove branding products:
- Local Homepage
- Native Search Ads
- Featured Agent
- Sold By Me
When we look at agent’s Share of Voice on Rightmove, which you can see on the bottom axis of this graph, with Average market share on the vertical axis, you can clearly see that agents who invest in their Share of Voice and have a stronger branded presence also have larger market share.
Agents who have more brand visibility also had more new instructions
We know that the end goal agents have in mind is generating valuations and converting those to instructions. So, we then asked ourselves if Share of Voice impacts the number of new instructions.
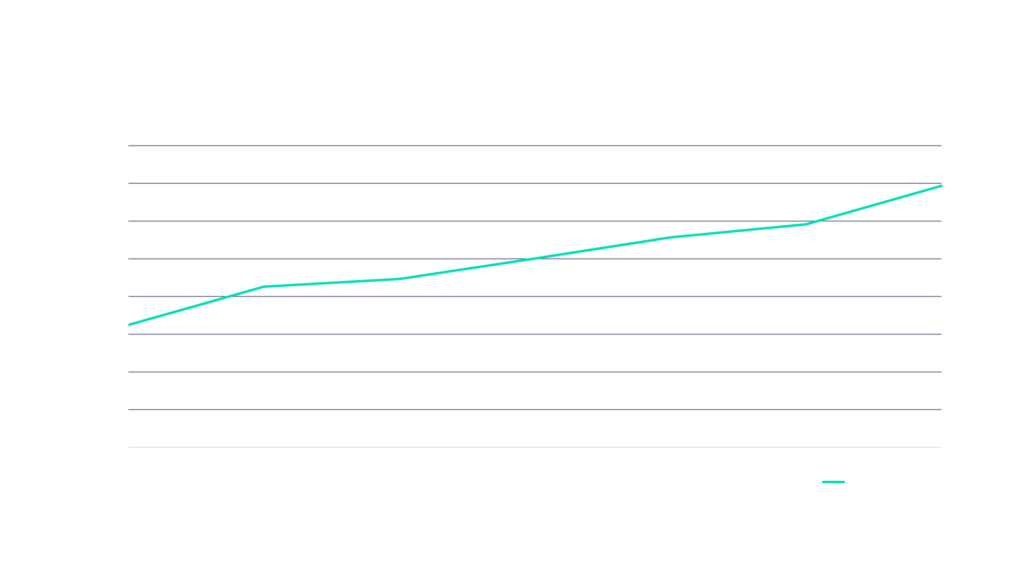
As you can see on this chart, with growth in share of voice (along the bottom axis) you can see that there is a growth in new instructions – it’s worth noting that this number is not an actual but is indexed.
Of course a number of other factors such as:
- How much competition you have
- How much your competitors are spending on branding and how much presence they have
- And the quality of your campaigns
will contribute to your overall success but for those that are looking to grow, the data shows you will need to have a higher share of voice than your competition.
The optimum blend of lead generation products vs branding products to support market share
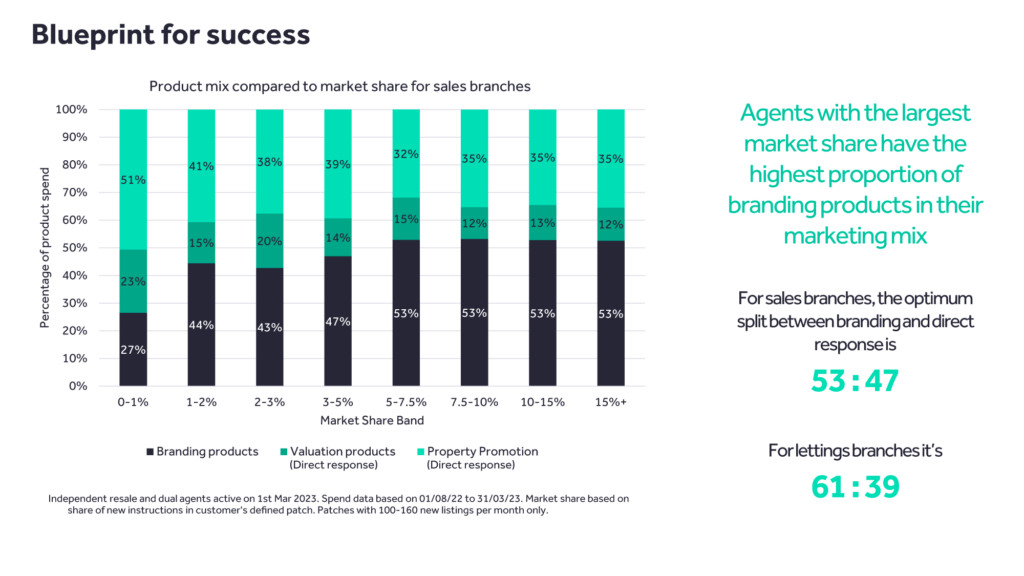
This data shows the market share band along the bottom axis and looks at what proportion of an agents’ total Rightmove Advertising spend and how that is split across the three product types.
In the teal at the top, you can see the percentage spent on Property Promotion products like Featured Property and Premium listing.
The middle band shows Valuation Generation products like Local Valuation Alert and Rightmove Discover.
Along the bottom in blue is the percentage spend on branding products.
There is a clear trend here – agents with a smaller market share are overly focussed on Property Promotion products (a type of lead generation) and not focusing enough on branding products. As you move up the market share bands, the agents in the higher market shares, are spending more on branding products, which of course, builds their Rightmove share of voice.
The optimum blend of lead generation products vs branding products to support market share
This data shows the market share band along the bottom axis and looks at what proportion of an agents’ total Rightmove Advertising spend and how that is split across the three product types.
In the teal at the top, you can see the percentage spent on Property Promotion products like Featured Property and Premium listing.
The middle band shows Valuation Generation products like Local Valuation Alert and Rightmove Discover.
Along the bottom in blue is the percentage spend on branding products.
There is a clear trend here – agents with a smaller market share are overly focussed on Property Promotion products (a type of lead generation) and not focusing enough on branding products. As you move up the market share bands, the agents in the higher market shares, are spending more on branding products, which of course, builds their Rightmove share of voice.
Want to grow your share of voice?
We’re here to support you to make data driven decisions to choose the branding products that will be the most effective for your local audience groups.
Our share of voice data will show you exactly where you stand against your competition on Rightmove and the right type of branding products for your local audience.
Discuss your share of voice with your Rightmove Account Manager.